Problem sets and quizzes are due before the start of class on the day on which they are assigned. Problem sets must be in PDF format and uploaded to Canvas (instructions for doing so are available in the document titled “How to scan assignments to PDF and post to Canvas”). If the assignment you turn in has multiple pages, please consolidate your assignment into a single PDF file.
Gamma Iota Sigma Chapter Meeting
Gamma Iota Sigma (GIS) is an international collegiate professional fraternity established in 1966 at the Ohio State University in Columbus, Ohio. Baylor University’s Alpha Pi chapter of GIS was founded in 2001. GIS aims to promote, encourage, and sustain student interest in insurance, risk management, and actuarial science as professions. Additionally, it seeks to enhance the moral and scholastic achievements of chapter members while fostering interaction between Baylor University and the business community through research activities, scholarship, and networking opportunities.
Join us for the inaugural chapter meeting of the Spring 2024 semester on Thursday, January 25, from 6:30 to 7:30 pm in Foster 322. We look forward to your participation!

Statistics Class Problem and Solutions
Here is the statistics class problem (and solutions) covered during today’s meeting of Finance 4335:
This week in Finance 4335
This week, we will cover a two-part statistics tutorial based on the Statistics Tutorial, Part 1 and Part 2 lecture notes (items 3 and 4 on the Lecture Notes page).
Due tomorrow (1/23):
- Readings listed for January 23 on the Readings page,
- Quiz 2 (Based on these readings), available from https://baylor.instructure.com/courses/197678/quizzes/374484.
- Problem Set 1 (Based on the Math tutorial last Thursday, available as item 2 on the Problem Sets page); turn in at https://baylor.instructure.com/courses/197678/assignments/1913927.
Finance: Insights into its meanings, etymology, and more from the Oxford English Dictionary
Kudos to my colleague Dr. Seward for bringing to our attention the many fascinating historical perspectives on the word “Finance” which appear in the Oxford English Dictionary:
Finance in the Oxford English DictionaryTo download this PDF document, click here.
On the ancient origin of the word “algorithm”
The January 23rd assigned reading entitled “The New Religion of Risk Management” (by Peter Bernstein, March-April 1996 issue of Harvard Business Review) offers a concise overview of the same author’s 1996 book entitled “Against the Gods: The Remarkable Story of Risk“. An intriguing excerpt from page 33 of “Against the Gods” elucidates the historical roots of the word “algorithm”:
“The earliest known work in Arabic arithmetic was written by alKhowarizmi, a mathematician who lived around 825, some four hundred years before Fibonacci. Although few beneficiaries of his work are likely to have heard of him, most of us know of him indirectly. Try saying “alKhowarizmi” fast. That’s where we get the word “algorithm,” which means rules for computing.”

Note: The book cover shown above is a copy of a 1633 oil-on-canvas painting by the Dutch Golden Age painter Rembrandt van Rijn.
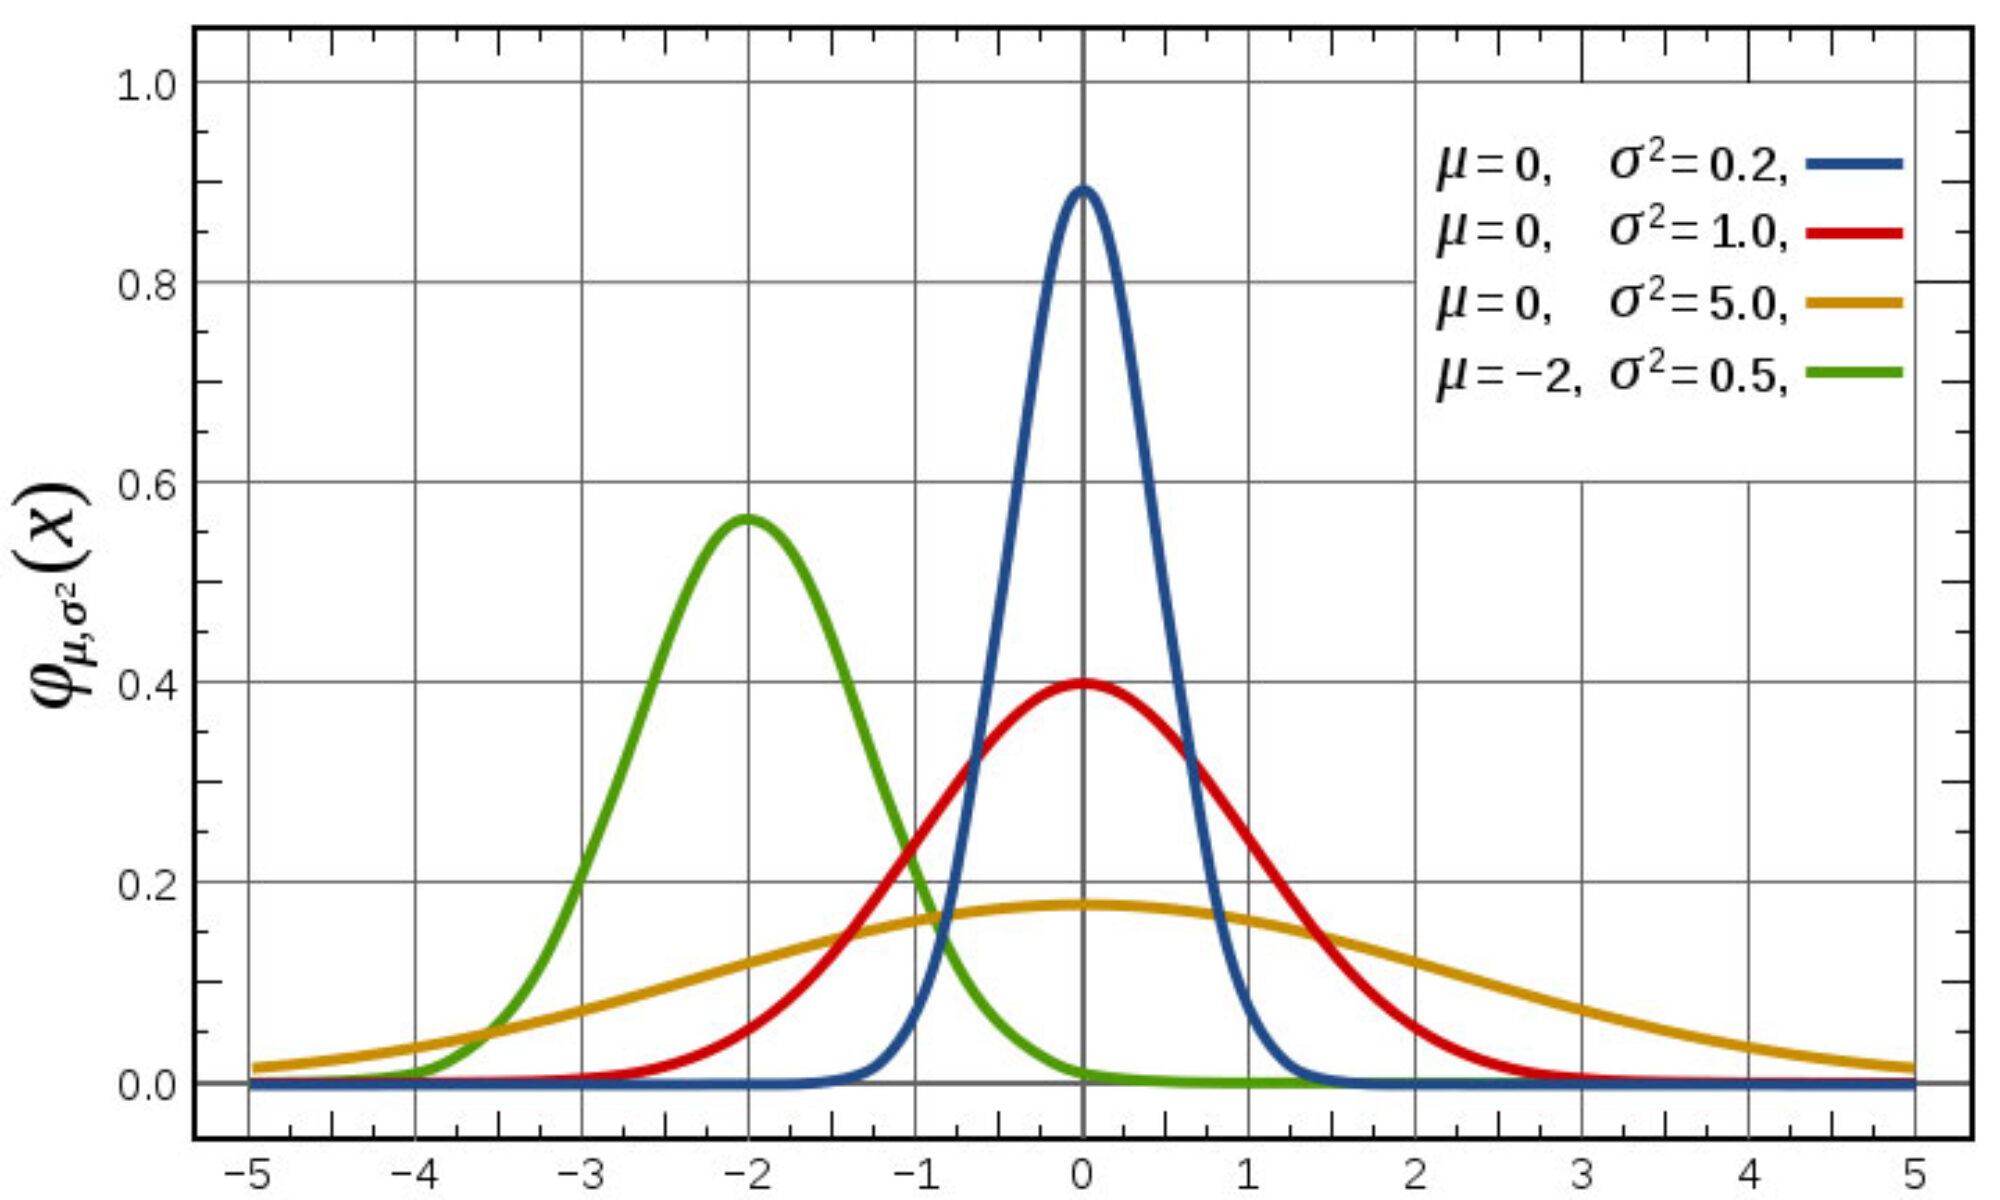
Visualizing Taylor Polynomials
On pp. 18-23 of the Mathematics Tutorial, I show how y = ex can be approximated with a Taylor polynomial centered at x=0 for 
How to know whether you are on track with Finance 4335 assignments
At any point throughout this semester, you can ensure that you are on track with Finance 4335 assignments by monitoring due dates on Canvas and the course website. Links for future class meetings, quizzes, problem sets, and exams appear on the Canvas “To Do” list. Links for readings (along with their due dates) appear on http://fin4335.garven.com/readings/, and links for problem sets (along with their due dates) appear on http://fin4335.garven.com/problem-sets/. In the case of assigned readings, students are required to complete a short (10-minute) readings quiz before the start of class for each reading assignment due date; the window for completing this task begins 24 hours before the start of the class meeting for which the reading assignment is due.
Rules for calculating (math) derivatives
Here’s a particularly useful list of rules for calculating (math) derivatives:

On the relationship between the S&P 500 and the CBOE Volatility Index (VIX)
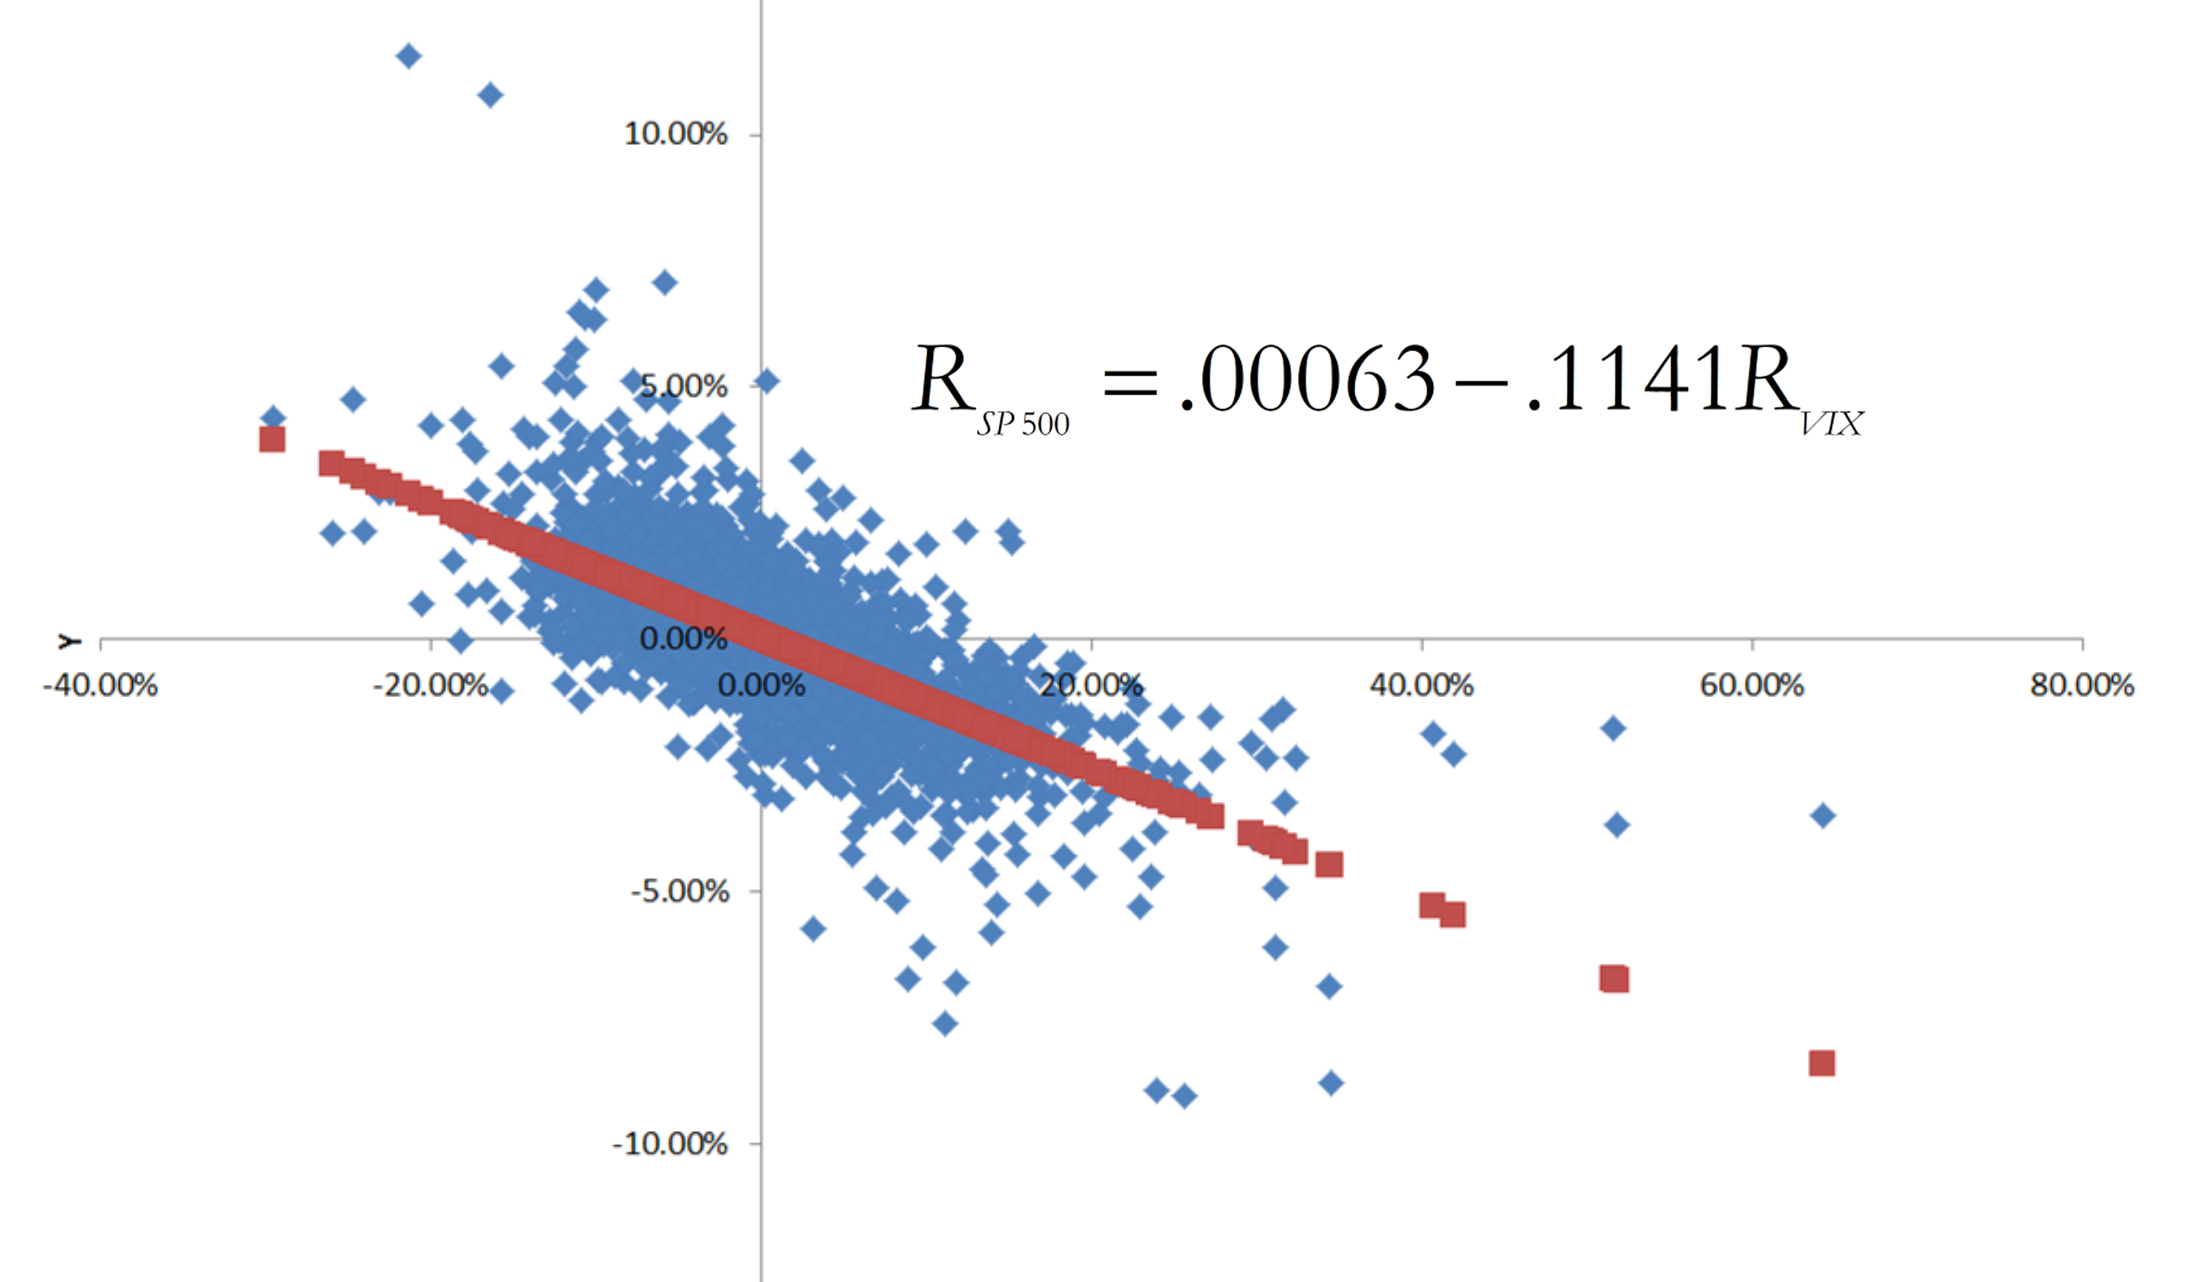
Besides going over the course syllabus during the first day of class on Tuesday, January 16, we will also discuss a particularly important “real world” example of financial risk. Specifically, we will study the relationship between realized daily stock market returns (as measured by daily percentage changes in the SP500 stock market index) and changes in forward-looking investor expectations of stock market volatility (as indicated by daily percentage changes in the CBOE Volatility Index (VIX)):
As indicated by this graph (which also appears in the lecture note for the first day of class), daily percentage changes in closing prices for the SP500 (the y-axis variable) and the VIX (the x-axis variable) are strongly negatively correlated with each other. The blue dots are based on 8,574 contemporaneous observations of daily returns for both variables, spanning 34 years starting on January 2, 1990, and ending on January 12, 2024. When we fit a regression line through this scatter diagram, we obtain the following equation:

where 

You can also see how the relationship between the SP500 and VIX evolves prospectively by entering http://finance.yahoo.com/quotes/^GSPC,^VIX into your web browser’s address field.